How do you feel when you see a dashboard you don't understand? Data Clarity is Key to Effective Reporting

Probably like many others: overwhelmed, unsure where to start, and with a touch of fear about your boss’s possible reaction. The reality is that, in many cases, a lack of clarity about the data is a common problem, especially when the report doesn’t have a clear visual format that facilitates understanding. The simple act of organizing and structuring data properly can be a challenge for many.
If you don’t change your approach to data, you could end up presenting numbers that look more like a secret code than useful information. Perhaps the next report will also include more difficult-to-interpret graphs. But don’t worry, there’s a way to change this. If you adopt a clearer visualization, your reports will become a decision-making tool, not a headache.
It’s not all about complicating visualizations to impress. Sometimes, simplicity is the right way to go. Less is more, and sometimes what you really need is clarity, not complexity. You don’t have to create vibrant color charts or complex infographics for your report to be effective. A simple, yet well-thought-out design makes all the difference.
Imagine you have to give directions to get to an unknown place, but instead of using a clear map, you’re given a maze. That’s what happens when data is not well organized or visualized: your audience ends up lost, even if you have the right answers. Data visualization is like a map, guiding people through the information without causing confusion.
According to a Forbes study, companies that adopt a data-driven approach make decisions more quickly and effectively, allowing them to stay competitive in a constantly changing business environment. Clear data visualization is key to achieving this agility.
In today’s era, where data is multiplying rapidly, it’s not enough to have access to it; you need to have the ability to interpret it quickly. The speed and accuracy with which you can extract insights from that data will not only improve your reports, but also strengthen your company’s strategic position. Therefore, integrating visualization tools can be the key to not only speed up processes, but also to gain a clearer and more accurate view of your business.
Have you ever found yourself in the situation of not knowing how to present data to your team?
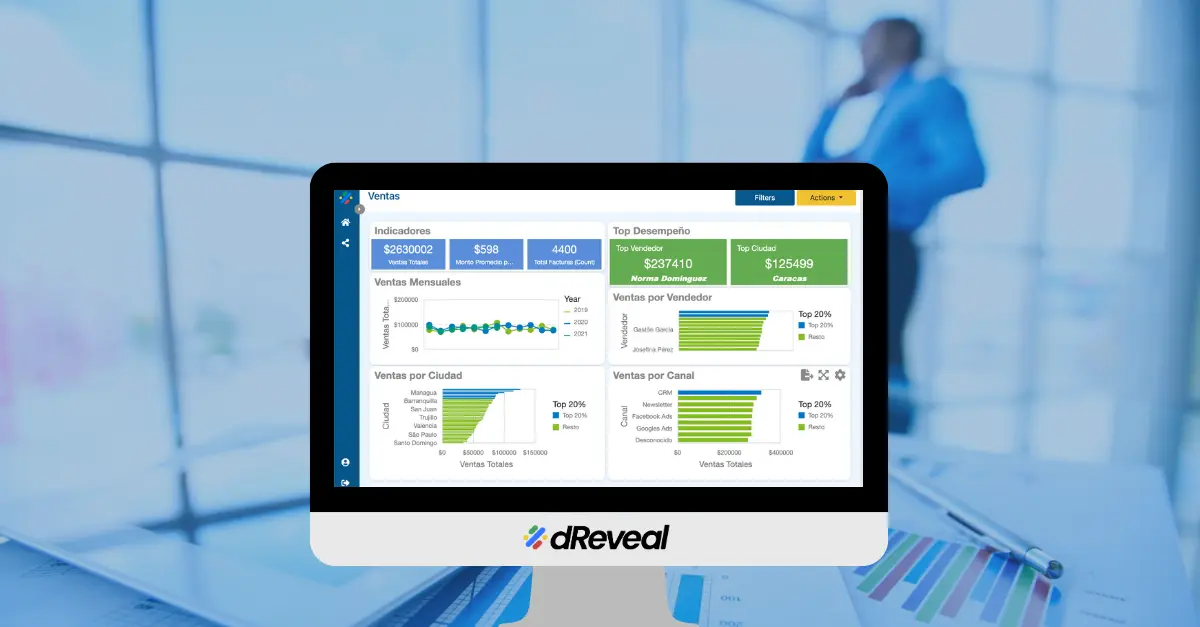
If you still have doubts about how to visualize your data effectively, we invite you to request a free demo of dReveal. With our tool, you can transform complex data into clear and easy-to-interpret reports, without the need for prior technical knowledge.


