Where Is the Money Leaking? Use Data Visualization to Identify Hidden Inefficiencies in Your Operations
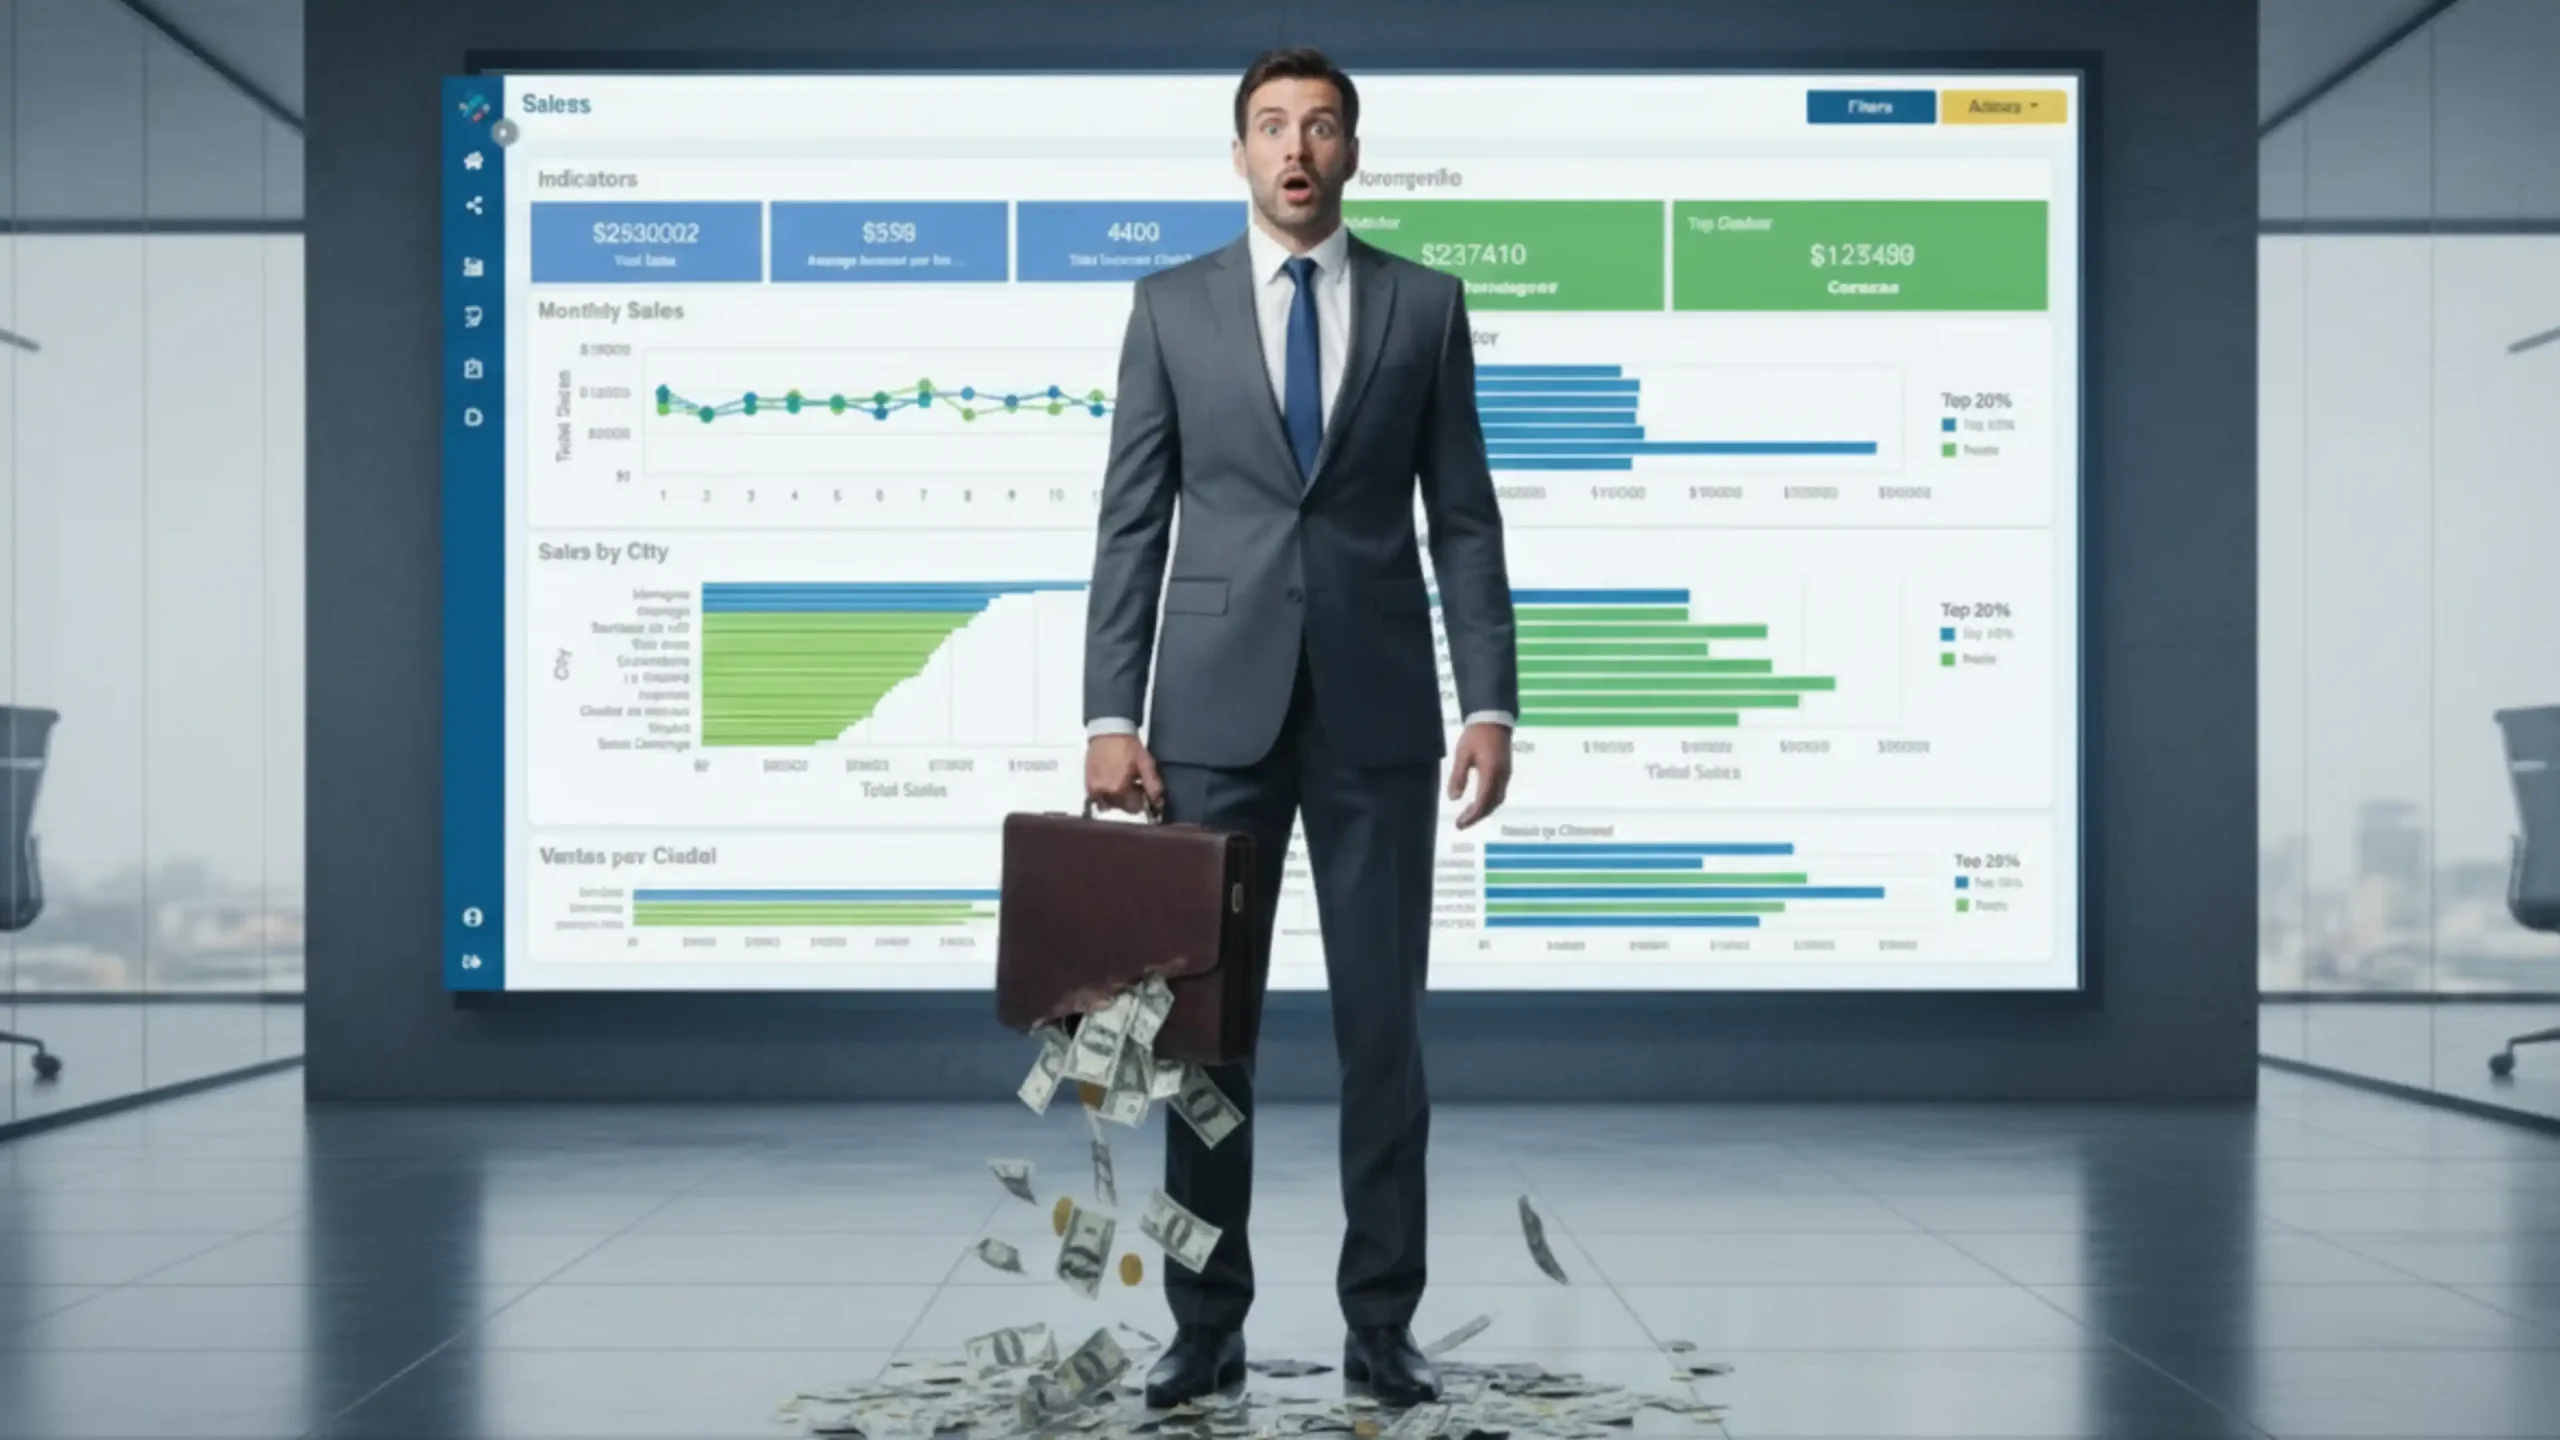
In every company whether a small business or a consolidated corporation there’s always an uncomfortable question: where is the money leaking?
Losses often don’t come from major mistakes, but rather from invisible inefficiencies that pile up day after day. The challenge is detecting them before they seriously impact margins.
The Problem of Hidden Inefficiencies
Executive teams often rely on static spreadsheets or outdated reports. However, the reality is that business processes change every hour:
- Production delays.
- Logistics costs that vary depending on routes or fuel.
- Operating expenses that repeat across departments without being questioned.
- Human resources invested in manual tasks that could be automated.
What is invisible today can easily become a financial sinkhole tomorrow.
How Data Visualization Makes the Difference
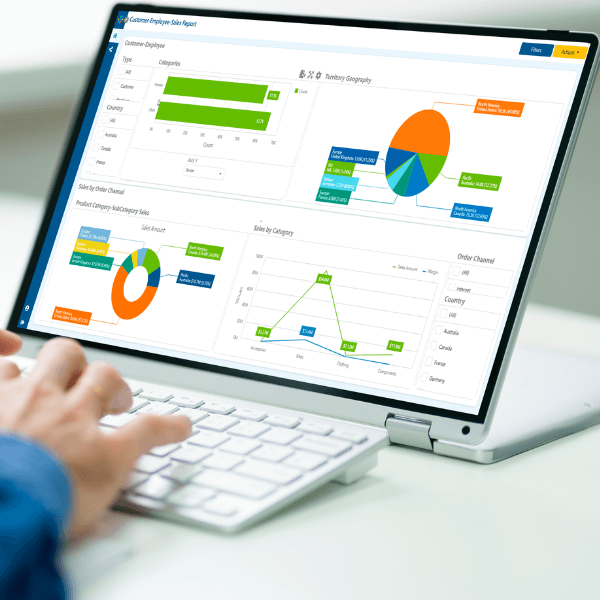
This is where data visualization becomes a strategic tool. It’s not just about pretty charts—it’s about mapping the real flow of money and resources within the organization.
With interactive dashboards and clear reports, managers can:
- Compare logistics routes and choose the most profitable one.
- Visualize process times to identify bottlenecks.
- Monitor resource consumption in real time.
- Cross financial and operational data, uncovering budget leaks.
The difference is that numbers stop being abstract and turn into concrete actions.
How Data Visualization Makes the Difference
This is where data visualization becomes a strategic tool. It’s not just about pretty charts—it’s about mapping the real flow of money and resources within the organization.
With interactive dashboards and clear reports, managers can:
- Compare logistics routes and choose the most profitable one.
- Visualize process times to identify bottlenecks.
- Monitor resource consumption in real time.
- Cross financial and operational data, uncovering budget leaks.
The difference is that numbers stop being abstract and turn into concrete actions.
Tangible Benefits
Companies that adopt data visualization as part of their operational control strategy achieve:
- Cost reductions of up to 30% by detecting invisible leaks.
- Faster decision-making based on updated data.
- Greater control and confidence over every area of the business.
- Prevention of major losses before they hit the bottom line.
In a competitive market, clarity in data means advantage.
Conclusion
Money doesn’t disappear by chance—it’s lost in small inefficiencies that aren’t visible at first glance. Data visualization gives your company the magnifying glass it needs to find them and turn them into opportunities for savings and growth.
👉 Want to discover where money is leaking in your business?
Schedule a free strategic session with our team and learn how to identify hidden financial leaks in your organization before they turn into major losses.
Recent Articles

Fewer Reports, More Impact
June 13, 2025