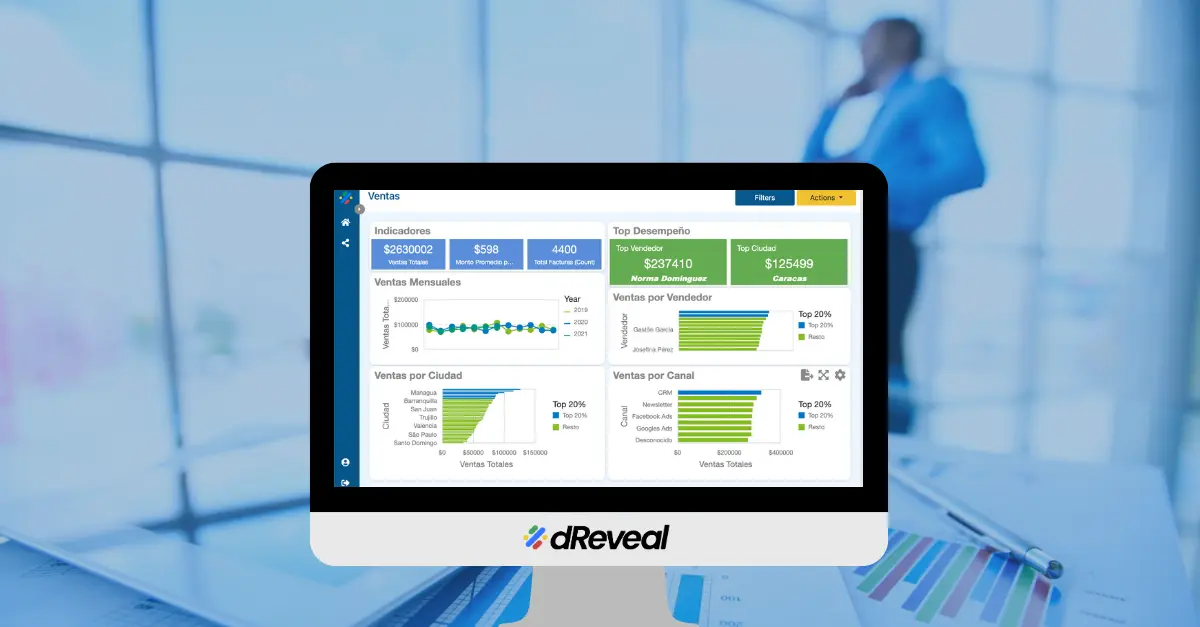
Why Does Your Team Ignore Reports? The Solution Is Simpler Than You Think.

Imagine this: Your team opens a report and within seconds knows exactly what to do. No questions, no confusion—just clarity and action. This isn’t a dream. It’s what happens when complex data turns into practical guides for day-to-day work.
In a world where change happens at lightning speed, data clarity is no longer a competitive advantage—it’s a basic necessity for businesses. Well-presented data doesn’t just save time; it enables faster, better-informed, and more accurate decisions.
Organizations that can quickly interpret and react to data—transforming complexity into clarity—don’t just respond better to market shifts; they’re positioned to outpace the competition.
72% of teams that use clear, easy-to-interpret visualizations make decisions faster and with more confidence (MIT, 2023). This is no coincidence. When data is presented intuitively, teams can spot opportunities, identify problems, and act immediately—without wasting time searching for information or deciphering confusing charts.
3 Ideas to Transform Your Reports (Starting Today)
1. Stop Burying What Matters
Does your report have 15 metrics, but only 2 are critical? Try this:
- Place key metrics at the top with a heading like “What Needs Your Attention Now.”
- Use simple comparisons: “Sales dropped 10%, but this product is growing… Why not push it further?”
- Cut everything that doesn’t drive action. Less is more.
2. Turn Numbers into Stories
Humans remember narratives, not isolated figures. Try this:
- Add a short phrase for context: “This sales spike matches the email campaign we launched Monday… Let’s run it again.”
- Use real examples: “When marketing adjusted their strategy based on this data, conversions rose 20%.”
- If a chart takes more than 3 seconds to understand, redesign it. Ask: “Are these visuals truly enabling action without confusion?”
3. Make It Collaborative
A report shouldn’t be a monologue—it should spark conversation. Encourage your team to:
- Add comments directly on dashboards: “Is anyone else noticing this trend?”
- Celebrate data-driven wins: “Thanks to this tweak, we saved 10 hours a week—great work!”
- Request feedback: “What info would help you do your job better?”
One Stat That Changes Everything
72% of teams using clear visualizations make decisions faster and with greater confidence (MIT, 2023). How much time could you save if your reports were this effective?
72% of teams using clear visualizations make decisions faster and with greater confidence (MIT, 2023). How much time could you save if your reports were this effective?
Your Challenge (If You Choose to Accept It)
This week, pick one report and ask: “How can I make it 30% clearer and more useful?” Sometimes, the smallest changes have the biggest impact.
This week, pick one report and ask: “How can I make it 30% clearer and more useful?” Sometimes, the smallest changes have the biggest impact.
Reports don’t have to be that tedious task everyone avoids. They can become the engine that drives agile decisions and tangible results for your team.
What if data became your team’s common language?
Let’s talk about how to make it happen for your company.
Schedule a strategy session here.


